Normalization vs Standardization vs Power Transformation
Feature scaling techniques to improve comparability of numeric input variables to a ML model.
| Normalization | Standardization | Power Transformation |
|---|---|---|
| Scale from 0 to 1 | Use mean as 0 and unit variance (SD of 1). Other values are scaled by their Zscore | Scales down magnitude -higher the number, the higher the reduction, |
| Changing the range of the input data. | Changing the shape of the distribution of the input data. | Changing the shape of the distribution of the input data |
| Results in a predefined range of values. | Will not result in a predefined range of values. | |
| Outliers are not handled | Outliers are handled are better | Outliers are handled (making it closer to a normal distribution) |
Underfitting vs Overfitting
| Underfitting | Overfitting |
|---|---|
| Training performance is poor. Testing performance is usually poor as well. | Training performance is good /high. ( i.e low error) Testing performance is not good enough ( higher error than training) |
| Why? Model is unable to capture relationship between Input (X) and target values (Y) | Why? Model is memorizing the data it has seen and it is unable to generalize unseen example. |
| Ex: Not preparing well enough for a certification exam | Ex: Preparing for a certification with just questions or dumps. |
| Training accuracy could be poor because model did not have enough data to learn from | Model doesn’t generalize well. Happens when model memorized training data |
| High Bias / Low variance | High variance /Low bias |
| Model is too simple. Need to increase complexity | Model is highly complex. Need to reduce complexity |
| Increase input features, feature engineering. Try data augmentation or new data collection | Remove some irrelevant features to reduce model complexity |
| Remove noise from data | Add some noise if training data is too clean |
| Increase number of epochs / training duration. i.e increase the passes on the existing training data | Early stopping the training phase |
| Decrease the amount regularization ( for eg. don’t use L1 regularization if it was used) | Increase the amount of regularization (Use L1 regularization to avoid using all the features ) |
| Use a different Network architecture | Dropout for neural network overfitting |
| Remove hidden layers for neural network overfitting |
Regularization – L1 (Lasso) vs L2 (Ridge)
| L1 (Lasso) Regularization | L2 (Ridge) Regularization |
|---|---|
| L1 Removes features of the input dataset | L2 does not remove features of the input dataset |
| L1 shrinks insignificant feature’s coefficient to zero -thereby removing the feature from the dataset | L2 shrinks coefficient of insignificant features to a smaller value, but the feature as such never gets removed |
| Works for Dataset with large number of features | Works for a dataset with medium number of features . Cases where dropping features entirely can reduce model complexity drastically |
| Reduces model complexity drastically | Reduces complexity, but not too drastically |
Learning rate and Batch size
Batch size and Learning rate should be adjusted by the same factor
| High Value | Low Value | |
|---|---|---|
| Learning Rate | Too large a learning rate might prevent the weights from approaching the optimal solution | Too small a value results in the algorithm requiring many passes to approach the optimal weights |
| Learning Rate | Loss function will be oscillating (Stuck at different Local minima) | the loss function will just slowly decrease and not oscillate |
| Learning Rate | Can skip Optimal global minima | Takes long time to reach optimal value (Global Minima) |
| Learning Rate | High value makes model very sensitive to outliers | Lower sensitivity to outliers |
| Batch Size | Large batch sizes appear to cause the model to get stuck in local minima . | Smaller batch sizes make the algorithm jump out of local minima and go towards global minima |
| Batch Size | Larger batch size will complete learning process faster but model may end up showing a local minima | Smaller batch sizes would slow down the learning process. |
| Batch Size | The Loss function would oscillate because of getting stuck in different local minima | the loss function will just slowly decrease and not oscillate |
Recall Vs Precision
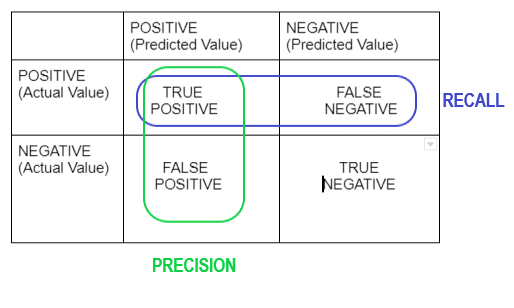
| Recall | Precision | Specificity |
|---|---|---|
| True Positive Rate (TPR) | Positive Predictive Value (PPV) | True negative Rate |
| Type II Error | Type I Error | |
| Recall = TP / ( FP + FN ) | Precision = TP/ ( TP + FP) | Specificity = TN / (TN + FP) |
| Percentage of positive cases out of the total actual positive | Percentage of positive cases out of the total predicted positive |
F-Score = (2 * Recall * Precision)/ (Recall +Precision)
Data Visualization
| Relationships | Comparisons | Distributions | Compositions |
|---|---|---|---|
| Scatter plots (2 values) | Bar chart (single value) | Scatter Plots | Pie chart |
| Bubble plots (3 values) | Line chart (one or more values) | Histograms | Stacked Area chart |
| Box plot | Stacked Area chart |

Leave a comment